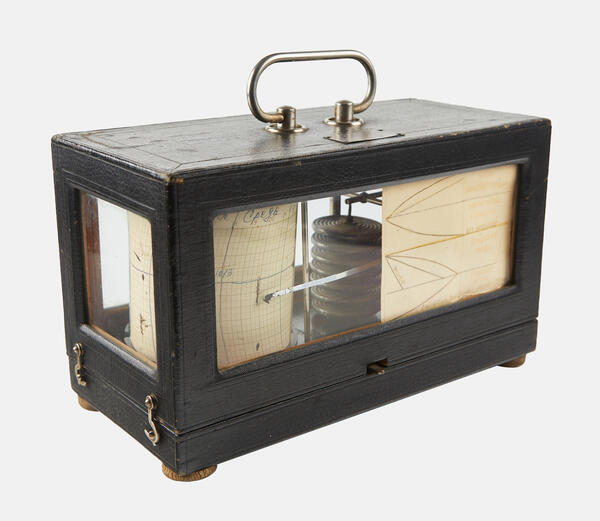
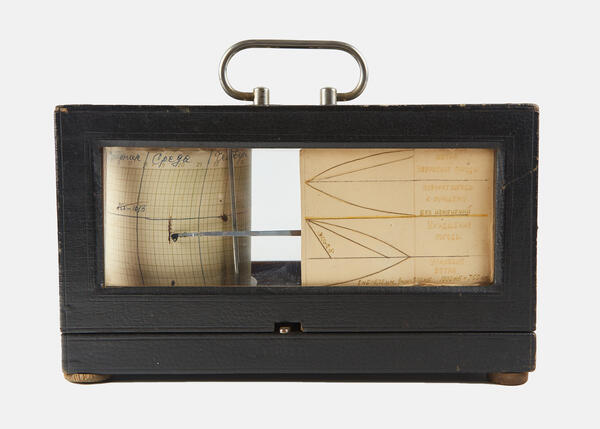
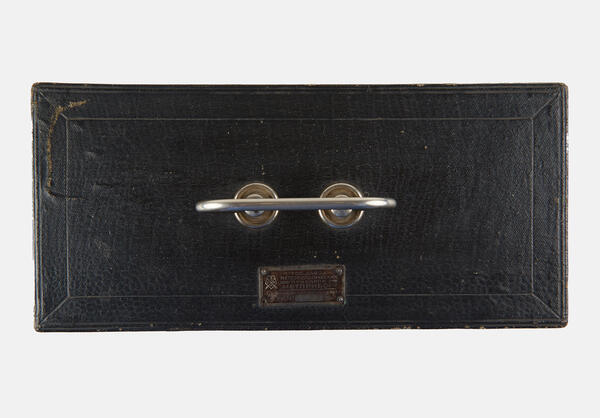
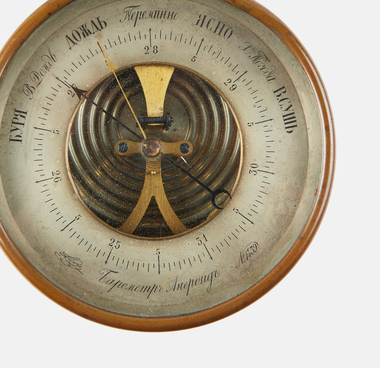
The collection of the Rusanov House Museum includes a barograph — an instrument that continuously records barometric pressure on a special paper chart.
Current meteorological data and weather forecasts, including observations of cyclones, are crucial for making the maritime industry safer. Weather forecasts are based on data collected over land and sea. Atmospheric pressure is the main weather indicator. Standard sea-level pressure, by definition, equals 760 millimeters of mercury per square centimeter. To measure air pressure, mariners use aneroid barometers and barographs. Weather is defined as the state of the atmosphere at a given place and time within a limited period — 24 hours, a month, or a year.
Recording atmospheric pressure on a special paper chart helps evaluate changes in atmospheric pressure over time and make appropriate forecasts. According to the operating principle of the sensor, barographs may be classified into the aneroid and mercury (weight and floating) types. Aneroid barographs are the most widely used. The sensor consists of several aneroid boxes that are fastened together. When the atmospheric pressure changes, the boxes contract or expand, causing the cover to move up or down. This movement is transmitted to a pen, which traces a curve on a ruled tape. A millimeter of vertical recording corresponds to about 1 millibar (mbar; 1 mbar = 100 newtons per sq m).
The barograph is divided into daily and weekly intervals according to the amount of time it takes for the drum to make a complete revolution. The operation of the barograph is checked by comparing it with a mercury barometer. Highly sensitive barographs are called microbarographs. A change in pressure of 0.1 mbar corresponds to 1–3 mm of vertical movement of the pen.
Standard atmospheric pressure equals 760 millimeters of mercury per square centimeter or 1,013.25 millibars (1,013 hPA). Low pressure can lead to better weather (if the wind speed decreases) and to worse weather (if the wind speed increases). Barometric tendencies can be identified by the shape of the barogram. If the curve is convex downward, the gradual fall in pressure means improving weather and less winds. If the curve is convex upward, the rapid decrease in pressure results in high winds and unsettled weather conditions. The same thing happens if the barometric pressure increases.
